

Catalog
Calculators
Describe what you need and the best calculators surface instantly — or browse all calculators by industry below.
Free tools
Buyer & seller tools
Estimate buyer affordability or build a seller net sheet — free, no sign-in.
Find the right calculator
What do you want to calculate?
Try:
Real Estate


Valuation
Seller Discretionary Earnings
Adds owner benefits and discretionary expenses back to earnings.
Open
Small Business


Construction


Marketing


Franchise (mom and pop shops)


Auto


Every calculator is free to run. Subscribe to save deals and export reports.
See plansSuggested roadmap
Rental property deal analysis
Run these in order to underwrite a rental or commercial deal end to end.
- 1Net Operating IncomeStart with income minus operating expenses.
- 2Capitalization RateTurn NOI into a market value / yield check.
- 3Property Value from NOIEstimate value from NOI and a target cap rate.
- 4Loan-to-Value RatioSize the loan against that value.
- 5Monthly Amortization PaymentCompute the monthly debt payment.
- 6Debt Service Coverage RatioConfirm the deal covers its debt.
- 7Cash-on-Cash ReturnMeasure the cash yield on your money in.
- 8Return on InvestmentFinish with the overall return.
Suggested roadmap
Buying a house
Size the loan, the monthly payment, and the all-in cost before you buy a home.
- 1Loan-to-Value RatioWork out your down payment and loan size for the home.
- 2Monthly Amortization PaymentEstimate the monthly mortgage payment.
- 3True Cost of a PurchaseAdd tax, closing fees, and total interest on top of the purchase.
- 4Appreciation RateProject how the home's value could grow over time.
Suggested roadmap
Buying a car
Work out what a vehicle really costs before you sign.
- 1True Cost of a PurchaseAdd tax, fees, and financing interest to the price.
- 2Monthly Amortization PaymentEstimate the monthly loan payment.
- 3Auto Total Cost of OwnershipTotal fuel, maintenance, and insurance, less resale.
- 4Mileage ReimbursementIf used for business, value the mileage.
Suggested roadmap
Big personal purchase
Decide whether a collectible or big-ticket buy makes sense.
- 1True Cost of a PurchaseFind the true all-in cost.
- 2Purchase Resale ROIEstimate resale return if it holds value.
- 3Return on InvestmentCompare against a plain investment return.
Suggested roadmap
Price a product or service
Set a price that covers cost, hits your margin, and pays back fixed costs.
- 1Price from MarkupStart from cost and add a markup.
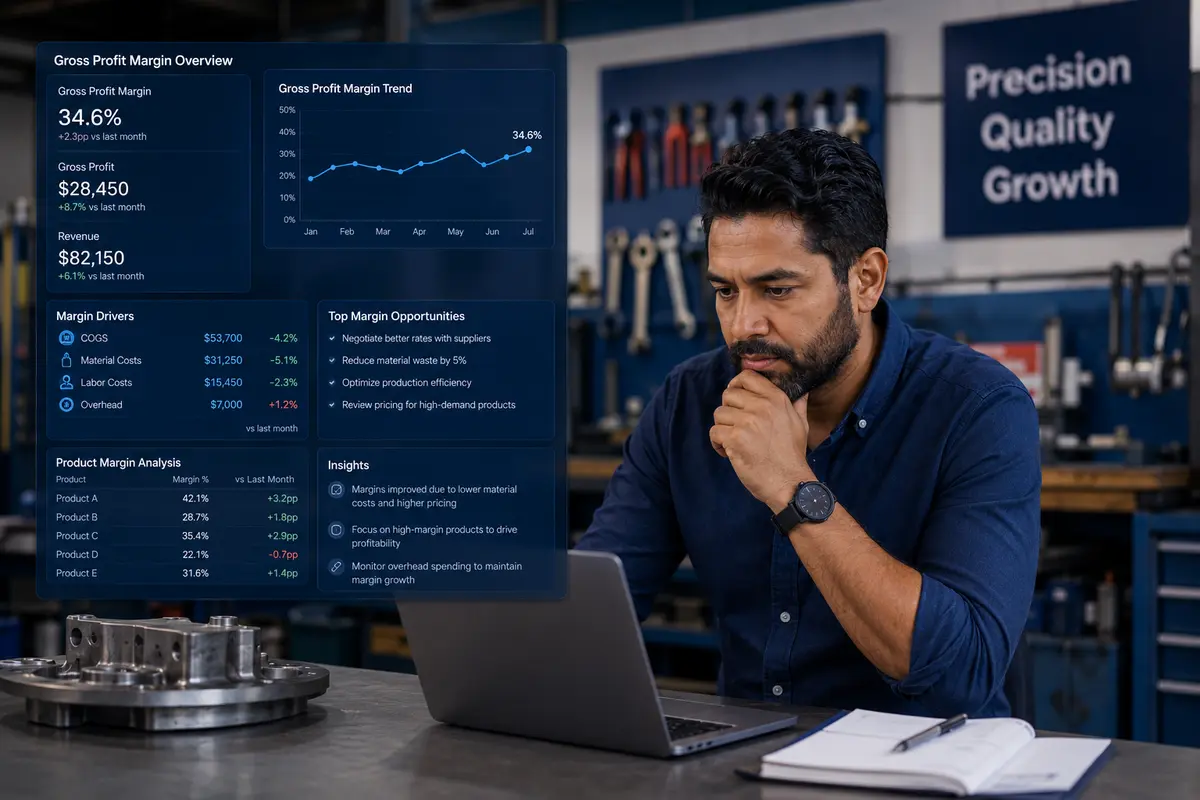
- 2Gross Profit MarginCheck the margin that price actually leaves.
- 3Break-Even UnitsSee how many units cover fixed costs.
- 4Customer Lifetime ValueWeigh the lifetime value each customer brings.
Suggested roadmap
Estimate and bid a job
Build a job estimate from materials and labor, then bid and check the margin.
- 1Material Cost with WasteTotal materials with a waste allowance.
- 2Labor CostAdd crew labor cost.
- 3Bid PriceMark up cost into a bid price.
- 4Job Profit MarginConfirm the margin on that bid.
Suggested roadmap
Marketing agency owners
The four numbers agency owners check to keep clients and campaigns profitable.
- 1Customer Acquisition CostFind what it costs to win each new customer.
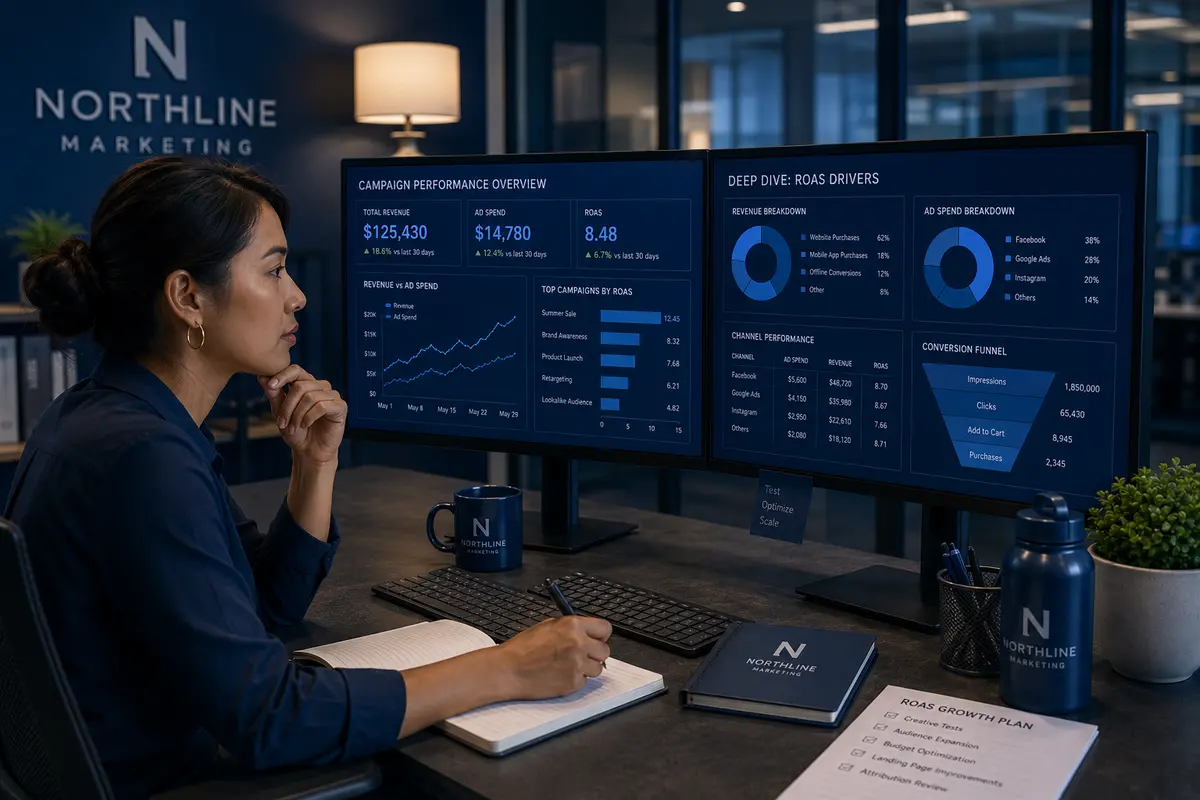
- 2Return on Ad SpendCheck the revenue each ad dollar brings back.
- 3Marketing ROIMeasure how well traffic turns into customers.
- 4Conversion RateSee which clients are actually worth keeping.
- 5Client ProfitabilitySee which clients are actually worth keeping.
Suggested roadmap
Run a coffee, tea, or food shop
The core numbers a small food or retail franchise watches to stay in the black.
- 1Gross ProfitStart with revenue minus cost of goods sold.
- 2Profit MarginSee how much of each sales dollar you keep.
- 3Break-Even SalesFind the sales needed to cover fixed costs.
- 4Labor Cost PercentageKeep wages in check against sales.
- 5Inventory TurnoverTrack how fast stock sells through.